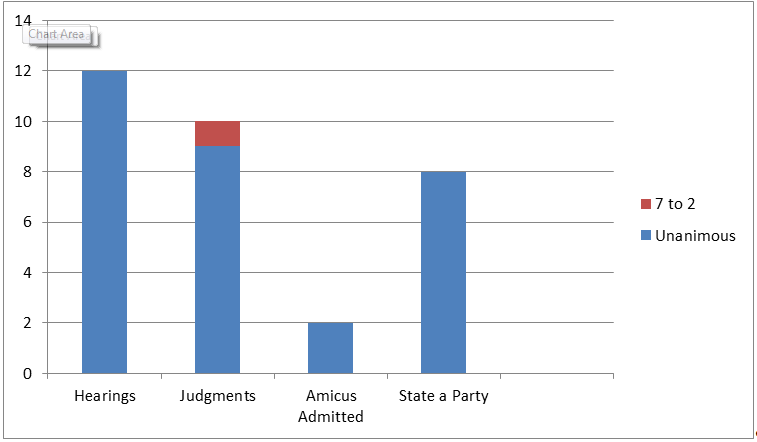
Overview of the Fourth Term 2013
This table shows an overview of the Fourth Term of 2013. Note that we count a judgment as delivered in the fourth term if it was delivered between the first day of the recess after the third term (1 October 2013) until the last day of the third term (30 November 2013).
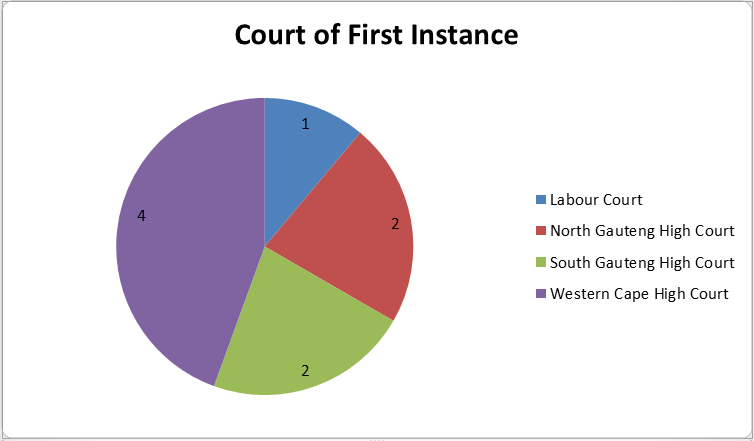
Access Statistics
This graph shows the court that first heard a case that ended up in the Constitutional Court.
Route to the Constitutional Court
This graph shows how a case got to the Constitutional Court, i.e. did it go straight from the High Court to the Constitutional Court, or was there first an appeal to the Supreme Court of Appeal.

Results of Appeal
This graph shows the results of appeals to the Constitutional Court in relation to the Court from which the appeal was held. For example, if a case was first heard in the Eastern Cape High Court, and then went on appeal to the Supreme Court of Appeal, the Eastern Cape High Court’s decision is not reflected on this graph, only the Supreme Court of Appeal’s decision is reflected.

Judge Statistics
| Justice | Participation | Written Majority | Voted with Majority | Written Concurrence with the Majority | Total in Majority | Written Minority | Voted with Minority | Total in Minority |
| Cameron | 6 | 1 | 6 | 0 | 100% | 0 | 0 | 0% |
| Froneman | 9 | 0 | 9 | 0 | 100% | 0 | 0 | 0% |
| Jafta | 9 | 0 | 8 | 0 | 89% | 1 | 0 | 11% |
| Khampepe | 3 | 1 | 3 | 0 | 100% | 0 | 0 | 0% |
| Madlanga | 6 | 1 | 6 | 0 | 100% | 0 | 0 | 0% |
| Mogoeng | 5 | 0 | 5 | 0 | 100% | 0 | 0 | 0% |
| Moseneke | 8 | 1 | 8 | 0 | 100% | 0 | 0 | 0% |
| Nkabinde | 9 | 1 | 9 | 0 | 100% | 0 | 0 | 0% |
| Skweyiya | 9 | 0 | 9 | 0 | 100% | 0 | 0 | 0% |
| van der Westhuizen | 5 | 1 | 5 | 0 | 100% | 0 | 0 | 0% |
| Zondo | 9 | 0 | 8 | 0 | 89% | 0 | 1 | 11% |
| Bosielo AJ | 3 | 1 | 3 | 0 | 100% | 1 | 0% | |
| Mhlantla AJ | 9 | 1 | 9 | 0 | 100% | 1 | 0% | |
